


One of the biggest challenges to maintaining a clean and trusted CRM is managing duplicate records. Whether they’re contacts or companies, duplicates can slow down your team, skew reports, and impact your outreach.
To give your team visibility into the number, source, and causes of duplicates in HubSpot, you can build a simple but powerful deduplication dashboard using custom reports. Getting this overview is an essential step in our Ultimate Deduplication Guide for HubSpot.
All the reports below use the Single Object Report Builder in HubSpot and leverage Koalify's duplicate detection.
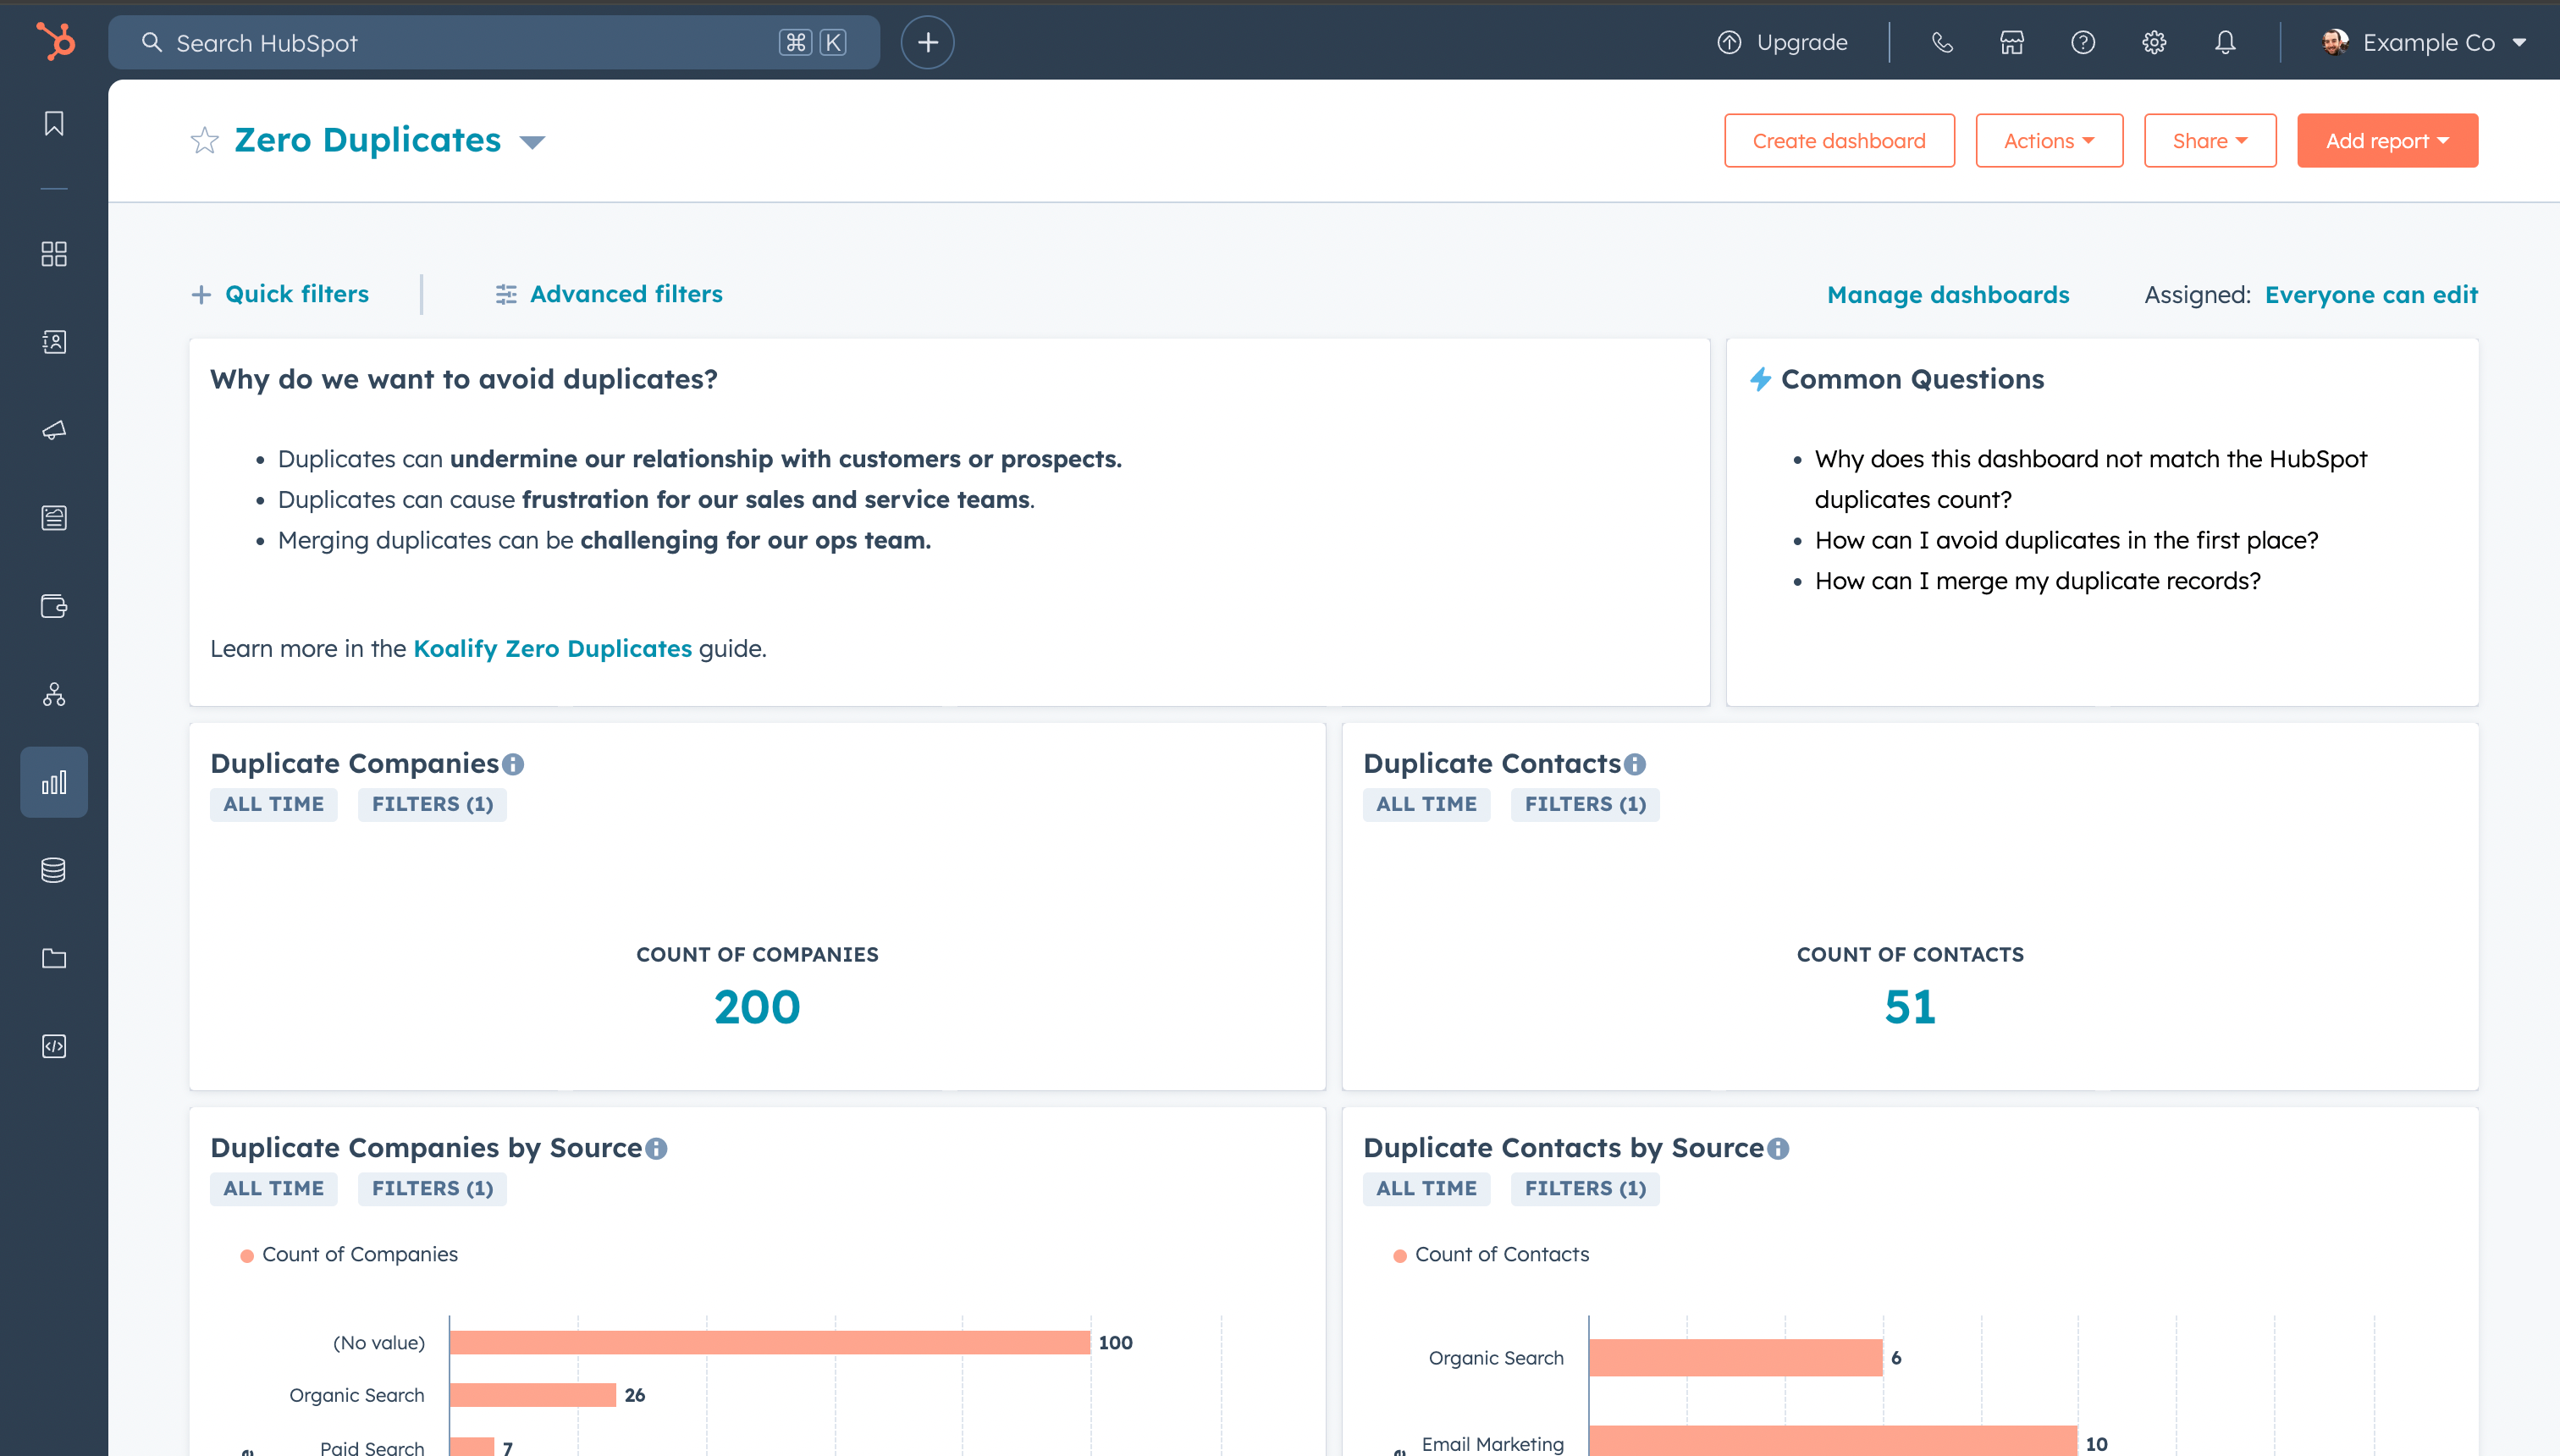
Report #1 - Duplicate Companies
📊 Use the KPI chart type:
→ Values: Count of Companies
→ Filter: Koalify Number of Duplicates is greater than 0
Report #2 - Duplicate Contacts
📊 Use the KPI chart type:
→ Values: Count of Contacts
→ Filter: Koalify Number of Duplicates is greater than 0
Report #3 - Duplicate Companies By Source
📊 Use the Horizontal Bar chart type:
→ Values: Original Source measured by Count of Companies
→ Filter: Koalify Number of Duplicates is greater than 0 and Original Source is Known
Report #4 - Duplicate Contacts By Source
📊 Use the Horizontal Bar chart type:
→ Values: Original Source measured by Count of Contacts
→ Filter: Koalify Number of Duplicates is greater than 0 and Original Source is Known
Report #5 - Duplicate Companies By Create Date
📊 Use the Vertical Bar chart type:
→ Values: Create Date (Monthly) measured by Count of Companies
→ Filter: Koalify Number of Duplicates is greater than 0
Report #6 - Duplicate Contacts By Create Date
📊 Use the Vertical Bar chart type:
→ Values: Create Date (Monthly) measured by Count of Contacts
→ Filter: Koalify Number of Duplicates is greater than 0
Report #7 - Duplicate Companies By Owner
📊 Use the Vertical Bar chart type:
→ Values: Company Owner measured by Count of Companies
→ Filter: Koalify Number of Duplicates is greater than 0
Report #8 - Duplicate Contacts By Owner
📊 Use the Vertical Bar chart type:
→ Values: Contact Owner measured by Count of Contacts
→ Filter: Koalify Number of Duplicates is greater than 0
Report #9 - Contacts By Duplication Property
📊 Use the Horizontal Bar chart type:
→ Values: Koalify Duplication Properties measured by Count of Contacts
→ Filter: Koalify Number of Duplicates is greater than 0 and Koalify Duplication Properties is Known
Report #10 - Companies By Duplication Property
📊 Use the Horizontal Bar chart type:
→ Values: Koalify Duplication Properties measured by Count of Companies
→ Filter: Koalify Number of Duplicates is greater than 0 and Koalify Duplication Properties is Known
Final Thoughts
A dedicated duplicate dashboard provides full transparency into your data hygiene and helps teams stay proactive. With the right visibility, you can resolve issues faster, improve CRM trust, and empower every team that depends on clean data.
To go further:
-
Explore the Ultimate Deduplication Guide to strengthen your entire deduplication process
-
Use our step-by-step guides to merge contacts and merge companies without losing context
Need help implementing this dashboard in your portal? Let us know, we’re happy to help!

